
[English inside]
Le esportazioni Italiane di spumante continuano a marciare per il verso giusto. I dati di maggio 2007 parlano di un incremento del 23% sia per i volumi che per il valore delle esportazioni. Muovendo su un piu’ consistente valore “annuo” la crescita si attesta sul 18% in valore (EUR325m) e sul 24% in termini di volumi (1.14m/hl). Nei 12 mesi a maggio 2007, le esportazioni di spumante hanno raggiunto il 9.7% del valore delle esportazioni italiane in termini di valore e il 6% del volume esportato. Il grafico evidenzia in modo chiaro questa tendenza di crescita: da ormai 5 mesi a questa parte la crescita si attesta sul 15-18% in base annua.

Italian sparkling wine export are performing extremely well also in May 2007. The date referring to the month is for a 23% increase in both volumes and value. Moving on a more consistent analysis of 12 month results to May 2007, we find quite similar growth rates: +18% for value (EUR325m) and +24% for volume (1.14m/hl). Sparkling wine are now 9.7% of Italian wine exports by value and 6% of volumes. The graph shows quite clearly this trend: in the last 5 months, the yearly growth rate (calculated on 12 months) is in the region of 15-18%.
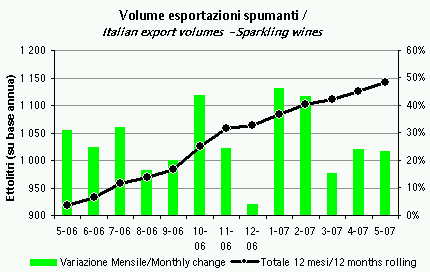
Questi due grafici rappresentano il volume e il mix delle esportazioni. Le principali conclusioni, simili a quelle dei mesi precedenti sono:
– i volumi crescono a un ritmo un po’ piu’ brillante del valore (intorno al 24-25%). Tra i paesi che piu’ contribuiscono a questo trend vanno sicuramente annoverati gli USA (+28%) e il Regno Unito (+30%) che con 175k/hl e 102k/hl sono rispettivamente il secondo e terzo paese dietro la Germania. Va poi sottolineato il balzo del 90% delle esportazioni in volume in Russia, che con 50k/hl e’ ormail il quinto-sesto mercato di destinazione.
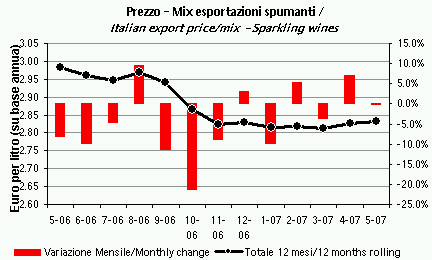
– il mix come vedete si e’ invece stabilizzato intorno ai EUR2.8-2.85, con degli andamenti mensili altalenanti ma nessuna variazione sostanziale, dopo il calo che si e’ consumato durante il 2006. A tale proposito, e senza dover ripetere che alcuni mercati sono strutturalmente diversi da altri (per esempio esportiamo a EUR2 in Germania tantissimo volume e a EUR7 in Olanda con volumi piu’ esigui), va segnalato che ad eccezione del mercato inglese (mix +18%), giapponese (+5%) e Russo (0%), tutti gli altri mercati importanti mostrano delle variazioni negative nel mix (circa –5% in Germania, USA e Svizzera).
These two graphs show the volume and mix of exports. The key conclusions are not very different from previous months:
– volumes are up by more than values (+24/25%). Among the countries which are contributing most to this trend we are to mention USA (+28%) and UK (+30%) which are the n.2 and n.3 markets for volumes after Germany with 175k/hl e 102k/hl respectively. We should then continue to underline the Russian market, which is +90% in volumes (and flat in mix) and which with 50k/hl is now the market n.5-6 for Italian sparkling wines.
– Mix has instead stabilised around EUR2.8-2.85, with a up-down monthly trend which is not affecting the overall picture, after the steep decline in 2006. The most interesting comment here (besides the usual disclaimer that markets differ substantially, such as Germany where we exporta a lot for EUR2 vs. Netherlands where volumes are low but price is EUR7) is the strong improvement in UK (mix +18%), Japan (+5%) and Russia (0%), while the other three key markets are declining (–5% in Germany, USA and Switzerland).
[TABLE=25]

