Questo post e’ costruito su una serie di dati per vitigno del mercato americano (ricavati da un articolo di Haeger/Storchmann) che ho trovato interessanti per una serie di motivi. Innanzitutto sono riferiti ai vitigni, e ci consentono di capire quali sono i rendimenti in dollari per ettaro dei diversi vitigni. Secondariamente, ci mostrano come la moda del Pinot Nero abbia portato i prezzi di questa uva alle stelle rispetto agli altri vitigni, nonostante, come e’ chiaro dallo studio, le temperature delle aree in cui e’ piantato sono ben lontane dal livello considerato ottimale per il vitigno (cioe’ quelle della Borgogna).
This post is built on some data offered by a study of Haeger/Storchmann which I found interesting for a number of reasons. First, it shows the trend of different grapes in US and it shows what is the dollar revenues for each of them. Second, it shows how the Pinot Noir is highly valued vs. other grapes, although as the study underlines the temperatures of the area are clearly far from the optimal level for the grape (ie Burgundy).
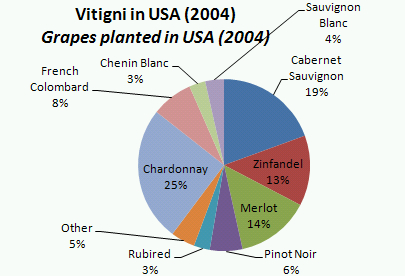
Questa torta vi indica la suddivisione del vitigno americano, dominato dallo Chardonnay (38k/ha nel 2004) e dal Cabernet Sauvignon (19% del totale). Come vedete il Pinot nero rappresenta soltanto il 6% del totale, ma dovete considerare che nel 1995 il vitigno era quasi non presente (3400ha contro i 9200ha del 2004). Quali sono i vitigni che crescono? Come vedremo, sono quelli che garantiscono degli introiti superiori: Cabernet Sauvignon, Merlot, Pinot Nero prendono il posto del Rubired, dello Chenin e del Colombard e soffocano lo Zinfandel e lo Chardonnay (stabili).
The first pie showed you the breakdown of US vineyard by grape, with Chardonnay dominating with 38k/ha in 2004, followed by Cabernet Sauvignon (19%). As you can see Pinot Noir was just 6% of the total, but you should consider that in 1995 it was nearly not present (3400ha vs. 9200ha in 2004). Which are growing grapes: Cabernet, Merlot, Pinot Noir are replacing Rubired, Chenin and Colombard, while Zinfandel and Chardonnay are just flat.
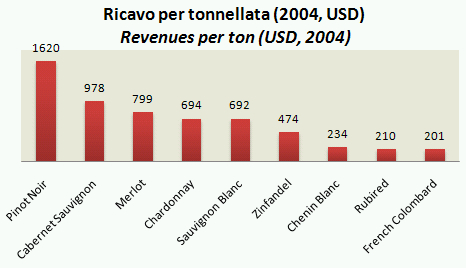
Come mai tutto questo interesse per il Pinot Nero? Per il prezzo di mercato delle sue uve, che come vedete nel 2004 era di ben 1600USD/ton, contro i 1000USD del Cabernet Sauvignon e gli 800USD del Merlot. Non a caso, questi tre vitigni sono quelli che abbiamo appena menzionato come quelli che crescono di piu’. Invece i vitigni in regressione come lo Chenin o la Colombard vedete che rendono meno di 250USD per tonnellata. Lo Zinfandel a 500USD e lo Chardonnay a 700USD si salvano mantenendo superfici stabili, il primo probabilmente grazie al fatto che e’ in parte considerato una sorta di vitigno autoctono per la zona.
Why all this interest for Pinot Noir? Because its market price is high. In 2004, it touched USD1600/ton vs. 1000 for Cabernet and 800 for Merlot. These three grapes are the ones growing more. Chenin and Colombard are below 250USD/ton, Zinfandel is at 500 and Chardonnay at 700 are just surviving, the first also thanks to the fact that it is felt as the real home grape in US.
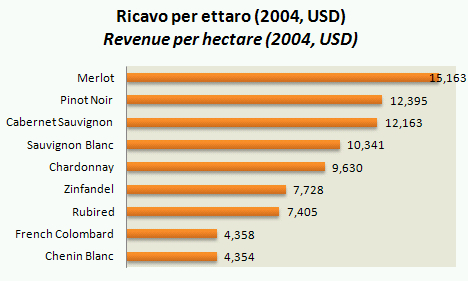
Prezzi per tonnellata moltiplicato resa… uguale ricavo per ettaro coltivato. E qui il Pinot Nero perde la sua leadership, superato dal Merlot, che si in maniera indiscussa il vitigno che ha garantito il massimo ricavo per ettaro a oltre 15000USD/ton. Poco sopra 12000USD trovate Pinot Nero e Cabernet Sauvignon.
Price per ton times yield… makes the revenue per hectare. And here Pinot Noir is losing its leadership as Merlot is showing a 15000USD/ton revenue vs. 12000USD for Pinot Noir and Cabernet Sauvignon.
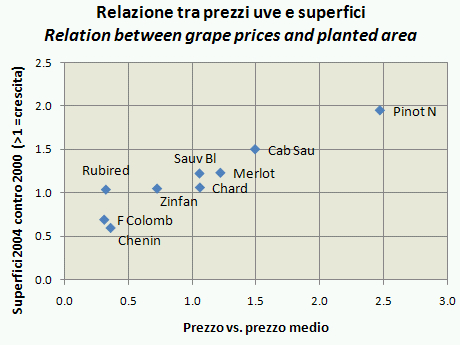
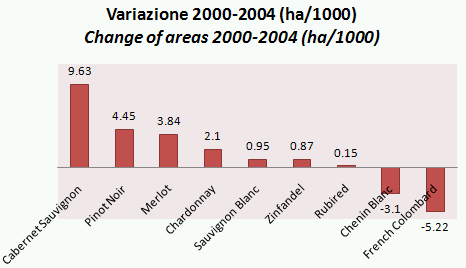
Questi valori sono esattamente lo specchio del trend della produzione, come potete vedere dal prossimo grafico che va un po’ spiegato: in orizzontale trovate il prezzo rispetto al prezzo medio, quindi trovate all’estrema destra il Pinot Nero e all’estrema sinistra i vari Colombard/Chenin/Rubired. L’asse verticale invece vi dice quanto sono le aree vitate del 2004 rispetto a quelle del 2000, quindi un valore superiore a 1 indica crescita delle aree (Pinot Nero sta a 2.5, che significa che nel 2004 c’erano 2 volte e mezza gli ettari del 2000). Non serve una linea di regressione per capire che il mercato americano si muove essenzialmente in relazione al ritorno sul capitale che viene garantito dal piantare un certo vitigno piuttosto che un altro. E forse, nei prossimi anni, non avranno pieta’ nemmeno per lo Zinfandel, anche se i 4°C di temperatura media che separano la Napa Valley dalla Borgogna forse significanto qualche cosa…
These values are exactly the mirror of the trend of areas, as you can guess from the last graph, which needs a bit of explanation. Horizontal axis you get the price vs. the average price, what is above 1 is above the average. Pinot Noir is therefore at the extreme right of the graph and in the left angle you see Colombard/Rubired/Chenin. In the vertical axis you see the ratio between areas in 2004 and in 2000. What is above 1 is growth. Again, Pinot Noir point is at 2.5 meaning 2.5 times the area in 2004 vs. 2000. You don’t need a regression line to guess that the American wine market is clearly following the return offered by different grapes. Maybe, in the coming years, they will even cut Zinfandel, even if the 4°C higher temperature of Napa Valley vs. Burgundy is maybe suggesting something about what wine comes out of the Pinot Noir.