
Dopo aver affrontato la questione delle abitudini dei bevitori per capirne la frequenza e le occasioni di consumo, proviamo oggi ad addentrarci nell’analisi del consumo per eta’, con i dati 1980-2005. In realta’ un’analisi simile l’avevamo gia’ affrontata quando parlavamo dei vini della Borgogna. Oggi pero’ possiamo andare a fondo, anche per capire come si muove la curva di consumo dei medesimi consumatori nel tempo. Cioe’ non solo sapere quanto bevevano i trentenni del 2005 rispetto ai trentenni del 1980, ma anche quanto bevevano i 55 enni del 2005 nel 1980, quando avevano 30 anni. Conclusioni: (1) la principale “sacca” di calo dei consumatori abiutali di vino tra il 1980 e il 2005 e’ quella 25 e 45 anni; (2) tra i non consumatori, il problema e’ paradossalmente tra i piu’ giovani: a 20-24 anni oggi il 63% non bevono mai vino, contro il 30% del 1980; (3) guardando agli stessi consumatori nel tempo si deduce che il picco di consumo tra 30 e 35 per i consumatori abiutali e verso i 60 anni per i consumatori occasionali. In entrambi i casi, l’area da “focalizzare” per educare al consumo (responsabile) di vino sembrerebbe quella tra 25 e 35 anni. In quegli anni i non consumatori diventano consumatori. I dati sono particolarmente interessanti: vi allego il file Google spreadsheets qui.
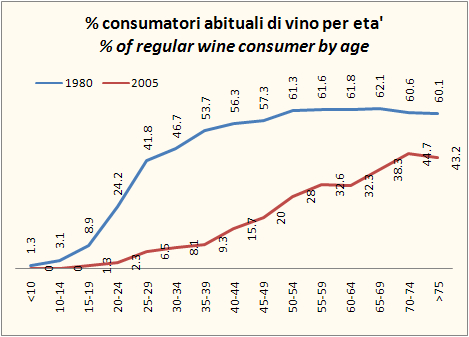
Consumatori abituali. Le due curve vi mostrano che cosa e’ successo in questi 25 anni. I consumatori abituali di vino a 70 anni sono calati dal 60% al 43-44%, mentre procedendo indietro verso i piu’ giovani la differenza si amplifica in modo molto significativo: tra 30 a 45 anni in Francia meno del 10% della popolazione consuma vino abitualmente, mentre nel 1980 si viaggiava tra il 45% e il 55%. La differenze e’ di oltre 44 punti percentuali tra 35 e 39 anni.

Se passiamo invece ai non bevitori, la differenza tra il 1980 e il 2005 non e’ significativa oltre i 50 anni (tra 6 e 10 punti in meno), mentre il picco del non consumo e’ chiaramente tra i giovani. Tra 20 e 24 anni, i non bevitori sono piu’ che raddoppiati. L’unica curva non drammatica e’ quella dei bevitori occasionali, che sono nel 2005 di piu’ di quanti fossero nel 1980, ma anche in questo caso si puo’ notare che nella fascia dei piu’ giovani sta iniziando una tendenza non positiva.


Infine, vi attacco i grafici piu’ difficili da leggere, ma piu’ interessanti. Ogni segmento “breve” sono gli stessi consumatori nel tempo, la riga lunga invece e’ la curva di penetrazione del 2005. Si tratta dei consumatori abituali di vino. Quando il segmento scende significa che gli stessi consumatori andando avanti con l’eta’ cambiano le loro abitudini di consumo. Nel grafico dei consumatori abituali, come vedete, la linea sale soltanto fino a 30-35 anni. Poi le linee tendono a diminuire, probabilmente a causa di problemi di salute (sovrappeso?). Nello stesso grafico dei consumatori sporadici, i segmenti sono piu’ in crescita il che significa che chi consuma vino “ogni tanto” e’ piuttosto difficile che abbandoni le sue abitudini (oppure che per tanti che da abituali diventano sporadici, ce n’e’ un equivalente che smettono definitivamente di bere).


After having addressed the issue of the habits of drinkers to understand the frequency and occasions of consumption, we try to address consumer age issue, with data from 1980-2005. In reality we have addressed it in some way in the past when talking about the wines of Burgundy. But today we can go in depth, to see how it moves the curve of consumption over time. Not only to know what people aged 30 were drinking in 2005 compared to the same age in 1980, but also what the 55 year old of 2005 were drinking in 1980, when they were 30 years old. Conclusions: (1) the main issue of less constant consumer of wine between 1980 and 2005 is between 25 and 45 years old, (2) among non-consumers, the problem is paradoxically the youngest people: in 2005 63% of for 20-24 years old never drink wine, compared to 30% in 1980 (3) looking at the same consumers over time suggests that the peak of consumption is between 30 and 35 for constant consumers and 60 years old for occasional consumers. In both cases, the area to “focus” to educate the consumer to wine would seem that between 25 and 35 years. During those years, non-consumers become consumers. The data are particularly interesting: I attached the file qui Google spreadsheets.
Consumers. The two curves show you what happened in these 25 years. The consumers of wine of 70 years old fell from 60% to 43-44%, while proceeding back towards the young ones amplifies the difference significantly: between 30 to 45 years in France less than 10% of the population consumes wine normally, while in 1980 they were between 45% and 55%. The differences is more than 44 percentage points between 35 and 39 years.
If we turn instead to non-drinkers, the difference between 1980 and 2005 is not significant for people olter than 50 (between 6 and 10 points below), while the peak of non-consumer is etween 20 and 24 years. The only nice curve is that of the occasional drinkers, who in 2005 are more than in 1980, but again you can see that in the range of the youngest people the trend is starting to worsen.
Finally, I show you the charts which are harder to read but more interesting. Each segment is the same consumers over time, the long line is instead ‘the curve of penetration of 2005. The first graph is for usual consumers of wine. When the segment drops it means that consumers with age are lowering consumption. The graph of consumers, as you can see, the line rises only up to 30-35 years old. Then the lines tend to decrease, possibly because of health problems (overweight?). In the same graph of sporadic consumers, the segments are trending upward.

