Incuriosito da questi dati sugli stock di vino appena pubblicati, mi sono messo a riguardare i dati del mercato italiano del vino e ho incrociato i numeri di Unione Europea, ISTAT, AC Nielsen/ISMEA e via dicendo per fare un piccolo bilancio del vino italiano: cioe’ produciamo (+), importiamo (+), beviamo (-) e esportiamo (-). Questo dovrebbe essere un primo bilancio. Ci sono poi gli utilizzi industriali (aceto, alcol, brandy e via dicendo) per giungere a una variazione delle scorte. Che e’ il dato che abbiamo dall’Unione Europea. Vi avverto subito che alcuni dati sono stimati e che e’ difficile far quadrare gli anni solari con le campagne vinicole. Pero’ il quadro che ne esce da una chiara idea di quello che sta succedendo: se le previsioni di 40m/hl di vendemmia sono confermate, avremo per la prima volta dopo tanti anni un saldo “primario” negativo per un paio di milioni di ettolitri. Quindi, come vedete dal primo grafico, le scorte potrebbero passare dai 42m/hl a circa 38m/hl assumendo circa 1.5m/hl di utilizzi industriali di vino.
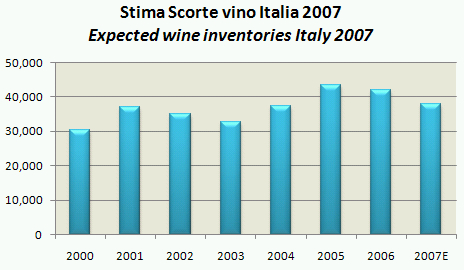
This post combines several data from different sources (ISTAT, AC Nielsen and European Union), trying to do a small balance of the Italian wine business: in other words we produce (+), we import (+), we export (-) and we drink (-). This balance is to be combined with industrial use of wine (vinegar, alcohol, brandy and so on) to derive the change of inventories. This one is supplied by EU. A disclaimer: some data is estimated and it is difficult to combine the solar year (for export, consumption and import) with the vintage year (for production and inventories. The picture is however quite clear: if the forecasts of 40m/hl wine production in Italy are confirmed, we will have for the first time after many years a “primary” balance negative by a couple of million hl. Inventories of wine might therefore decline from 42m/hl to 38m/hl, assuming roughly 1.5m/hl of industrial use of wine.
Vediamo cosa significa e come ci siamo arrivati. Nel corso degli ultimi 4 anni le esportazioni sono salite da 13m/hl a 19m/hl, aumentando la soglia dei “consumi” da 42m/hl a 44m/hl. Nel frattempo le importazioni sono salite di poco, da circa 1m/hl a 1.5m/hl. Di fatto oggi il sistema italiano sarebbe in grado di assorbire circa 43-44m/hl di produzione, a patto di riuscire a mantenere i volumi esportati intorno a questo livello (che e’ il massimo storico e che comincia a dare qualche segnale di indebolimento). Come vedete, nel corso degli ultimi 6 anni, circa 6m/hl medi annui sono “spariti”, se consideriamo il saldo delle scorte cosi’ come lo fornisce l’Unione Europea. Ma nel 2007 sembra che stia per succedere qualcosa di diverso: assumendo un 3-4% di calo dei consumi e le esportazioni su cui abbiamo visibilita’ ormai fino a Settembre, con una vendemmia per ora stimata a 40.5m/hl saremo in deficit di 2.5m/hl. Caso unico nella storia degli ultimi anni.
Let’s see in details how we got to these numbers. During the last 4 years, export grew from 13m/hl to 19m/hl, therefore consumption plus exports moved from 42m/hl to 44m/hl. In the same period, imports were slightly up, from 1 to 1.5m/hl. Today, we might conclude that the market might absorb 43-44m/hl of production, assuming we are able to maintain a 19m/hl export (which is a peak and which seems to start to deteriorate). As you can see, over the last 6 years, an average of 6m/hl were taken away: we get to this data by comparing our balance with the actual change of inventories supplied by EU. In 2007, it seems that the story is changing: with a 3-4% decline of consumptions and with the exports at 19m/hl (quite visible target at this point in time), with a 40.5m/hl production we would have a 2.5m/hl deficit. A unique situation for the last years.
[TABLE=43]
Ho poi calcolato qualche indicatore. I also provide you with a few ratios.
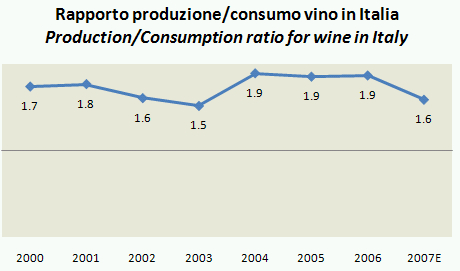
• Primo, e piu’ semplice, produzione contro consumo. Come vedete siamo stati nell’ultimo triennio quasi al doppio di produzione contro consumo, un livello un po’ superiore ai primi anni 2000. Se la vendemmia 2007 si conferma a 40m/hl, saremmo a 1.6x
• First, and more simple, production against consumption. This ratio moved to almost 2x in the last 3 years, growing from 1.5-1.7x for the past year. In 2007, this ratio might move to 1.6x.
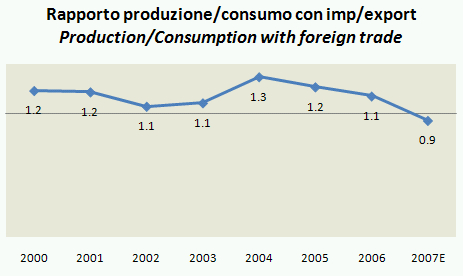
• Secondo, un indicatore piu’ completo, abbiamo aggiunto alla produzione le importazioni e al consumo le esportazioni. Quindi abbiamo un indicatore riguardo il fatto che una vendemmia aggiunga o tolga dalle scorte prima di tutto il resto (distillazioni e via dicendo). In questo secondo grafico notate che la riga sta piu’ vicina a 1 (che significa bilanciamento perfetto), salvo la vendemmia record del 2004 che gia’ si combinava a consumi piuttosto bassi. Quest’anno il sistema potrebbe andare in deficit, giustificando cosi’ un rialzo dei prezzi delle materie prime.
• Second, a more complete ratio: we added to production the imports and we added to consumption the exports. We have therefore a ratio which above 1 signals the excess of production (we don’t count industrial utilization). As you can see this line is closer to 1 than the previous one (Italy is an exporter of wine). This year the line could fall below 1x, therefore implying what we are witnessing: an increase of raw material costs.
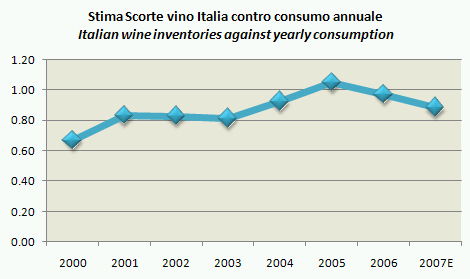
• Terzo, un indicatore per determinare quanti anni di “consumo apparente” (consumi+export-import) rappresentano le scorte attuali di vino. Come vedete siamo passati da 0.6 anni, a 0.8 nel 2001-03, poi siamo saliti a superare un anno nel 2005, per ridiscendere poco sotto 1 anno nel 2006. Il 2007 potrebbe arrivare a un livello di 0.85-0.90.
• Third. This ratio is to show how many years of apparent consumptoin (consumption plus exports minus imports) are current wine stocks. As you can see Italy was at 0.6 in 2000, it moved to 0.8 years in 2001-03. Than we gradually grew to over 1 year in 2005 to go back to 0.95 in 2006. In 2007 this ratio could be at 0.85-0.90x.