OIV ha prodotto qualche settimana fa il suo documento infra-annuale sulla situazione della viticoltura mondiale, dando una prima stima della produzione di vino nel mondo nel 2007. Ne risulta un quadro piuttosto peculiare, rispetto a quanto si e’ visto negli ultimi anni: il calo della produzione in molte nazioni ha per la prima volta prodotto una annata in cui non c’e’ sovrapproduzione di vino, considerando come suggerisce OIV di considerare che 30m/hl di vino sono ogni anno consumati per produrre distillati e aceto. Veniamo ai numeri: OIV stima una produzione di vino nel 2007 di 261-271m/hl (nel grafico e in tutte le elaborazioni trovate il valore centrale di 266m/hl), con una riduzione di 10-20m/hl rispetto alle due annate precedenti (2005 e 2006, sempre stimata) e 30-40m/hl sotto la vendemmia record del 2004 di 300m/hl.
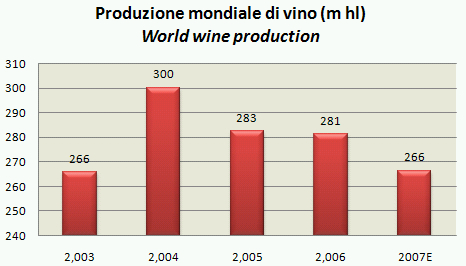
A few weeks ago OIV produced an interim document reporting on the 2007 wine production. The picture is quite different from what we saw in the last few years: the reduction of the wine production in many countries seems to have created a picture in which for the first time there is no wine surplus, including as suggested by OIV a 30m/hl of wine which is used for industrial uses and production of wine spirits, brandies and winegar. OIV estimates a wine production of 261-271m/hl (we use in the graph the average level of 266m/hl) with a reduction of 10-20m/hl vs. the 2 previous years and 30-40m/hl below the record level of 2004 of 300m/hl.
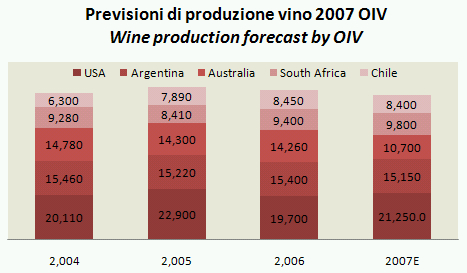
Da dove arriva questo calo? La risposta e’ piuttosto semplice, il calo e’ tutto europeo. In altre parole, al di fuori dell’Europa, la vendemmia disastrosa in Australia (da 14 a 10m/hl) e’ stata quasi completamente compensata dalle buone vendemmie degli USA (21m/hl da 19.7m/hl) e del Brasile (da 2.3m a 3.1m/hl). Cosi’ al di fuori dei paesi europei, la vendemmia 2007 dovrebbe essersi attestata intorno a 71m/hl, contro i 72m/hl del 2006.
Where is the origin of this decline? The answer is simple, the slowdown is entirely explained by Europe. In other words, outside Europe the significant decline in Australia (from 14 to 10m/hl) has been nearly fully compensated by the good grape crush in USA (21m/hl from 19.7m/hl) and Brazil (from 2.3m to 3.1m/hl). As a result, out of the European countries, 2007 wine production should be in the region of 71m/hl, vs. 72m/hl reported in 2006.
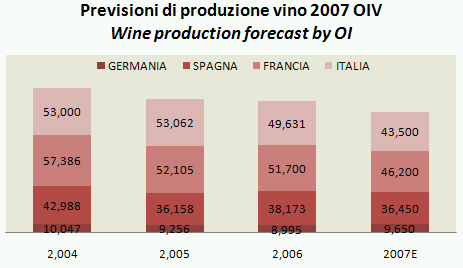
Dall’altra parte, nell’EU-27 siamo nell’ordine di 160m/hl, un calo dell’8% circa rispetto ai 168m/hl del 2006. Passiamo quindi in rassegna i mercati europei, sottolineando che qui ho riportato i dati OIV anche se su alcune vendemmie (Francia e Italia) potremmo mettere dei numeri piu’ precisi. Nei 4 grandi produttori europei (Spagna e Germania oltre ai due menzionati) la riduzione e’ stimata a circa il 9% o 13m/hl. Il calo e’ concentrato in Italia e Francia (-6m/hl ciascuna secondo OIV), mentre in Spagna si prevedono 1.5m/hl in meno rispetto al 2006 (ma ben 13m/hl sotto il record del 2004) e in Germania ci potrebbe essere un piccolo recupero. Per gli altri paesi europei le cose non sembrano migliori: Grecia -13%, Portogallo -22%, Ungheria -3%. Gli unici posti dove le cose sono andate bene sembrano essere alcuni paesi dell’Est Europa, quali Slovenia (+11%), Bulgaria (+13%) e Romania (+20% a un livello piuttosto interessante di 5m/hl).
In Europe (27 countries) 2007 wine production will top 160m/hl, with a 8% decline vs. 168m/hl in 2006. Looking at the key markets, I show in the graph the performance of the 4 main markets: please consider that for Italy and France we have (worse) data, but we don’t use it in order to keep a fully compliant set of figures. The 4 key producers are down 9% or 13m/hl. The reduction is concentrated in Italy and France (-6m/hl each according to OIV), while in Spain OIV expects a 1.5m/hl reduction vs. 2006 (but 13m/hl below the record production of 2004) and in Germany production should be marginally up. For the other European countries, figures are not better: Greece is down 13%, Portugal is down 22%, Hungary is -3%. The only countries where figure are good are in East Europe in countries such as Slovenia (+11%), Bulgaria (+13%) and Romania (+20% to a quite interesting level of 5m/hl).
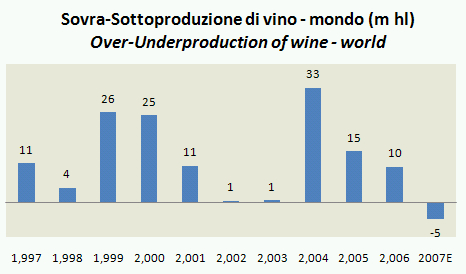
Passiamo al bilanciamento del mercato mondiale. Come vi dicevo prima, OIV sottolinea che circa 30m/hl di vino sono consumati per fini industriali o di produzione di distillati e aceto ogni anno. Ritiene quindi che il mercato sia stato sostanzialmente in equilibrio. In realta’ il nostro grafico, dove la linea segna la produzione e le due aree i consumi, mostra che il mercato e’ stato sostanzialmente in sovrapproduzione e soltanto nel 2007 si puo’ immaginare di passare in una situazione di deficit (meglio sarebbe parlare di riduzione delle scorte).
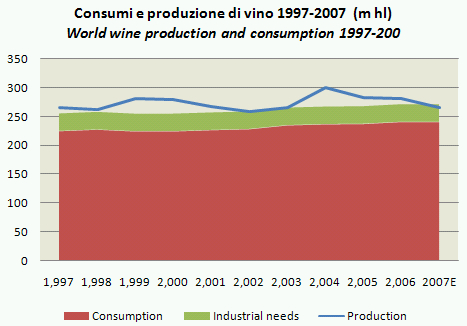
Moving to the balance of world production, as I was anticipating, OIV underlines that 30m/hl of wine is used for industrial purposes, for the production of brandies and vinegar. It is therefore expected that in 2007 the market will be in equilibrium. According to our graph, where the line is the production and the area is consumption, the market is on a overproduction trend and only in 2007 we might imagine a deficit situation (which would be more likely a reduction of inventories).